Version 2
I will use the earlier PCB, but I have a few changes in mind for the version I am going to build and I'll go through these elements here.
Here is the schematic Greg made for the meter:
The front end of the design is the most critical. I'll implement that by following the PCB design. For the processor part, I originally wanted to use the same Arduino Nano that Louis Scully is using, but since the PCB layout is for an Arduino Pro Mini I'll use that. However, I have no need to drive a multi-color back light LCD, and I also do not foresee any other enhancements that will eat up the Arduino ports, so I see no need to use the Display42 PCB from Greg with the I2C MCP23017-E/SP chip.
To cut down on the amount of wires going from the Arduino the the LCD, there are 6, I am using a module that is available on eBay for a very small price :
LCD Interface
The LCD that I'll end up using will be this one :
16 x 2 White on Blue LCD
My design will also power the unit from a battery, to avoid grounding issues and provide a clean supply to begin
with. However, rather than using normal batteries, I will use a
rechargeable cell, and I want to provide a way to charge them while
using the instrument, and also when not in use. To keep taps on the
voltage level or discharge level while not on mains, I need a monitor
that will warn me when the voltage is getting too low.
Here is the circuit that I used to implement the button debounce, used to select two modes, and the power section.
One word of caution before I dive in. The DC chassis part is not quite like the Eagle symbol I used in this diagram. There is no short between the plus and minus when there is no plug inserted! The minus is however isolated from the chassis when there is no plug inserted, keeping everything isolated from the chassis. If the DC plug is inserted, you could potentially create an earth ground connection to the DUT. There is an indication on the LCD by the charging symbol, so you won't forget.
You'll notice that I deviated from the design Louis used
for the two buttons. I have quite some experience now interfacing
buttons if you have followed my Raspberry Pi posts. The processor of the
Pi runs at 900MHz or more (yes, no typo), and interfacing with something as
slow as a button has its challenges. Especially for inexpensive buttons.
You'll be amazed how noisy they can be.
In any case,
the filtering that I use to get rid of most switch bounce noise is by
using an R/C filter on both edges (closing and opening). I always prefer
to use active high buttons or switches because they avoid all sorts of
power-on problems. When the switch/button is open, the capacitor is at
ground level. Closing the contact will charge the capacitor through the
10K series resistor, creating a nice and clean rising edge (R/C) towards
the input of the Arduino. Releasing the switch will cause the capacitor
to discharge through the 10K series resistor plus the 1K to ground,
again creating a nice R/C slope that will filter the high speed bounce
noise. In software we can use a little delay to get rid of the slower
bounce transitions, and together this will create clean signals to the
Arduino program without having to resort to Schmidt-trigger gates or
Flip-Flops.
One word of caution. Don't make the debounce capacitor much larger than 10nF. If you
don't have 10nF, you can go as low as 1nF. The reason for this is that
the slower the R/C slope, the more time the signal stays in the
undefined area between digital "high's" and "low's" and that can cause glitches for the processor again. If I peaked your button
interest, have a look here :
Debouncing buttons There is a lot more to buttons than you may think.
The power section
The power design is quite simple, and I've used that before. The two Schottkey (low drop) diodes D2 (this diode can actually be a 1N400X type) and D3 will decide which supply is feeding the Voltmeter. If the mains is connected (providing the 15-30V DC), D2 will have the higher voltage so it will win. If there is no mains connection, the battery supplies the voltage. The resistor (R1) in parallel of D3 determines the (re)charge current of the Ni-CAD cell. The charging current is about 0.1 x C for a 250mAh cell. Depending on the capacity of the cell(s) you're using you may need to change the value of R1 so it is within the (re)charging specification of the cell(s).
In order to keep an eye on the charge level of the cell, I have added a few parts to allow the Arduino to measure the voltage level. You don't want to run into a situation where the voltage is too low, because you may introduce errors in the measurements. Besides, you don't want to be caught with an empty battery when you're in the middle of something. R2 and R4 create a 3:1 voltage divider with easy to find resistors. You can create 20K with 2 x 10K in series. (don't use less than 10K for R4, or it will negatively influence the ADC conversion) C4 is a small filter to get rid of noise and the output goes to one of the Arduino ADC inputs. The rest is done in software and I have also designed some battery level symbols to make it look nice.
The complete multi-meter draws less than 60 mA. About 26mA of that is used by the LCD display. With less than 100mA, it is safe to use the 78L12 part for the 12V regulator, and even the 78L05 for the 5V regulator on the PCB.
If you are already an Arduino user, you may have the Mini Pro, and you also may have the required programming cable. If not, here is a source that provides both as a bundle :
Arduino Pro Mini with interface
The display and interface to the Arduino
Here is a picture of the small interface board that will turn the LCD module into an i2c capable interface, reducing the number of wires to 4, while staying compatible with the PCB.
You need to install a new LCD library to get the i2c driver, and I selected the library from here :
i2c / LCD library
This library is tailored for a particular interface board, the FaBo #212 LCD I2C Brick, but the only difference is the i2c address with the board I have.
First of all, you need to know the i2c address of your board.
I used a little sketch to do that:
i2c address scanner
My address turned out to be 0x27, while the FaBo brick uses 0x20.
After you have installed the new i2c-LCD library on your system, you need to edit the FaBoLCD_PCF8574.h file that is in the library source section, and change this line :
#define PCF8574_SLAVE_ADDRESS 0x27 ///< PCF8574 Default I2C Slave Address = 20
The Enclosure
The enclosure I use has partnumber bi0002562 and is described as a "high quality aluminum project box/enclosure case" with the sizes 150x105x55mm. Links don't stay up for long so you have to use Google to find it, or search within eBay or AliExpress.
The finished hardware
Here is a picture of the finished project. I actually build two units, because one can never have enough voltmeters. My design and the changes I made allows me to position these meters very close to my prototypes, and without any power wires attached. I can also make floating measurements, because nothing is connected to the housing. (the DC socket inputs are isolated from the chassis if no power plug is inserted)
Below is a link to the copy of the Arduino sketch. There are many changes to the original code, so have a good look at what has been changed in case you use different hardware.
I have been playing with the two units, to see what the accuracy is and what I could change in the user interface.
I must say that I am very impressed with the accuracy! I have two calibrated voltage reference units, and also a new/freshly factory calibrated 4.5 digit bench multi-meter. The accuracy and precision of this design is astounding for such a simple and inexpensive tool.
Tweaking the hardware
I was a little apprehensive about feeding the LCD display with the same 5V supply as the rest of the logic. These displays are notorious for introducing spikes and noise, so I was on guard for trouble.
When I got my scope attached, I was not surprised by the noise I found, so I started with decoupling the 5V power where it enters the display module. I used a Tantalum 3.3uF together with a 100nF to begin with, because the i2c and the LCD do not have any decoupling.
Here is how that looks:
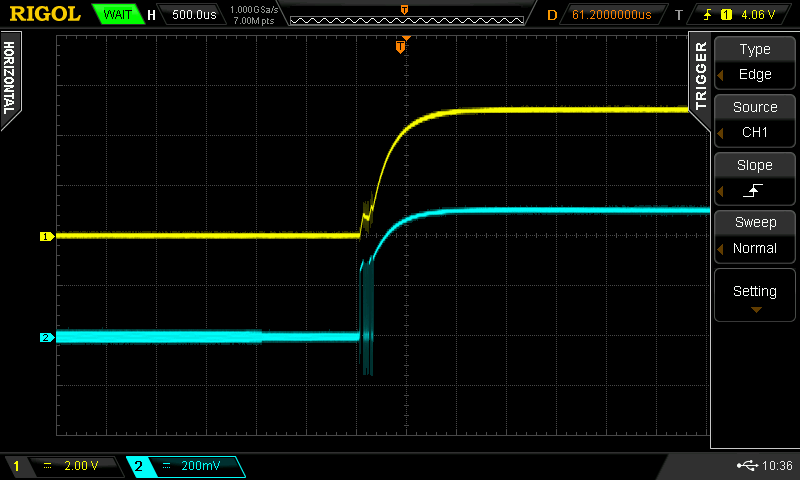
Unfortunately, this did not reduce the nasty spikes on the reference voltage and the main 5V by much. Looking into it some more, I found that the switching of the LTC_CS line to start/stop the AD conversion cycle turned out to be the culprit. Here is a screenshot:
The top trace (A) is the LTC_CS signal coming from D10 at the Arduino PCB. The bottom trace (B) is the 4.096V reference, AC coupled. The spikes are clearly caused by the switching at the digital port. They are a few nSec in width, so I selected a 4n7F capacitor that slowed the edge down enough to not cause a spike anymore. I mounted that capacitor on the PCB of the Arduino, with one leg soldered to D10 and the other end to the unused GND mounting hole just next to it. The capacitor can be seen just north of the reset button.:
And this is the result:
I also noticed a potential bug in the original code, related to the averaging of the results. The Spi_Read function discards a reading of the ADC if it's not ready, but the main loop code counts it as a valid sample, which could result in wrong measurements. I have fixed the code, but I could not find instances of this error when I looked for it with a Logic Analyzer.
While I had that out, I also looked at the timing in more detail, to see if there were any potential conflicts.
First of all, this is a picture of the ADC sampling window:
Here you can see that the CS is going down to start the cycle and the MISO is ready 1.25uS later, virtually at the same time. There is 1.5uS between that event and the first clock going high. This is after I already eliminated the little delay in the original Spi_Read code. It is not needed. You can see here the four data bytes getting read, and the actual data presented on the MISO. Note that at the third clock, we are reading the third status bit (SIG), and that indicates a V-in signal > 0. The data towards the end is the "real" 28 bit data, of which the last 4 are the "extra" sub LSB's and they are discarded in the main loop after the averaging. (look at the datasheet for details)
I selected 8 samples to be averaged in my code, and then prepare the result to go to the LCD. As I mentioned earlier, these LCD's are very noisy. In our case, this has no real influence, because the LTC2400 is put to sleep after we have read the data, and made the CS pin high again, as you can see above.
Here is a screen shot that shows the end of the data (channel 5) going through the I2C bus to the LCD, and the beginning of another acquisition cycle:
You can see that we have a "quiet" period after the LCD got updated, and the start of a new ADC acquisition, which is 0.129 mSec (T1-T2). The total loop time, from LCD update to LCD update is 1.5 Seconds in my case. Sending the results to the LCD only takes about 36 mSec.
Here is a picture of a complete loop:
The "dead" time, averaging the results and sending it to the LCD is only 0.22 Seconds.
After playing with the meter, I got more and more dissatisfied with the flopping around of the last 3 digits, even when I have a stable voltage reference connected to it.
Averaging, Smoothing & Filtering
At first I played around with the averaging, but that is really no solution for a system that has 24 bit resolution. The reason is the inherent amount of noise when you are down to the micro-Volt level. Below is a sample of my 2.5V reference, using my then un-calibrated voltmeter (the reference is calibrated as having 2.49993V)
Averaging (using 8 values) does not have as much influence as you may think. There is still quite a bit of noise.
So, still not good enough. I then looked at smoothing, see below, but that was not good enough either, so I turned to filtering.
I tried a few approaches, and then really investigated an Infinite Input Response (IIR) filter design. And that showed a lot of promise:
Blue is the original input, red the filtering effect with a factor of 4.
And here with a factor of 48.
This filter is based on the "weighing" of the new samples, based on a division. The divisor is fixed and above I used a factor of 48. This means that a new sample only contributes to 1/48th of the value to the averaged total.
So filtering is much better then averaging, but I was not satisfied yet. Because what happens if the input voltage changes, like when you try to adjust a voltage? I then looked at resetting the averaged result if the sample was significantly different enough from the averaged result. I used a 5 sample input filter to avoid spikes resetting the filter, and that worked very well. If a new voltage was applied, it only took 5 cycles of 0.165 Sec. to switch to the new input.
I have just about zero experience with filters, and this extra code I designed myself, but I was convinced that there must be better methods available. I eventually found the Kalman filter, which is used a lot, and initially it seemed perfect for this application.
Knowing nothing about it, I searched and found a very nice tutorial on YouTube that explains the Kalman filter very very well, even for total Dummies like myself. (look for Michel van Biezen - Special Topics - The Kalman Filter) I wrote a simplistic version of the filter based on his explanation but was not satisfied with the result. I also worked with another example I found, but that had the same problem.
Neither of them worked with relatively quickly changing input changes, as an
example when switching from 2.5V to 10.0V. They both took several
seconds to show the new value. Not good for a DMM, Bummer!
So Kalman looked great on paper and in simulation (using Excel), but in reality, using my Volt Meter, it was a lot worse than the IIR filter I already used.
However, I stole a concept from the Kalman filter, namely the Gain calculation. This is a dynamically calculated weighing factor, so I wrote some code around my IIR filter that accomplished what I wanted. Details are in the code. The result is fantastic, I think.
If I now connect the meter to a really stable voltage, like from a reference, 5 decimal digits are rock solid with only the 6th flopping around due to the noise. When I switch from one reference voltage to another one, within a few cycles, the voltage is updated and within a second or so the 5 digits are rock solid again.
When I tested the ability to set a voltage manually with a power supply (one of those I built in the other Forum posts), I was amazed how well the response to my tuning and the accuracy was, but I also saw how noisy my older version power supplies turned out to be. (luckily, not the one I designed myself) That's what you get when you are using a 24bit ADC with micro-voltage resolution. Oops!
Additional Calibration Levels
In any case, with this filter in place, I also added a separate calibration function, to calibrate the Volt Meter to my Voltage Reference. I already use the (Zero) Null Volt calibration to null the input level, but I now also can tune the meter to my Voltage Reference as well.
With the new calibration function, the accuracy you can obtain is now much better as well.
With all this done, I no longer needed the original code to reduce the number of decimal digits, so that piece of code went into the bit-bucket. In the process of going through the filter designs, I also saw a way to get to a more stable and precise acquisition delay for the LTC2400. The delay is now dynamically calculated.
Because I needed to save the calibration factor for the voltage reference, I needed to store a floating point number in the EEPROM. Turns out, the library we already used has that feature, so I could clean-up more of the code, and send two more functions from the original code into the bit-bucket.
My dual-button press now drives the zero calibration with a short press, and a long press enters the reference calibration.
With all these changes and loop tuning, the main loop time is now about 165mS, so the display is very responsive.
V3.11 update:
I found a bug in the filter calculation, based on a rounding error. This is caused by dividing a long by a float, and the result going into a long again. The solution was to use a float as the result. The compounded rounding error caused the filter result to be a little bit below the raw averaged input level.
The difference between the filter result after 1000 samples, and the calculated median value in Excel is now very, very small.
I also added the filter weight exponent multiplier to the display.
V3.12 update:
Because the linearity of the meter was not as good as I had hoped, I created a way to measure the output value of the ADR4540B chip, and updated that factor in the code. To measure that voltage with my still un-calibrated meter, I first calibrated the meter with my 5V0 reference, to get as close as possible to the voltage of the ADR4540 output. In order to do that, I created a special cal function for all my reference voltages. Now you can select any of them, just update the cal factors in the code.
Calibration Procedure [updated july 2020]
There are three, optionally four parts that need to be performed to fully calibrate the meter. Before you start with this section, you need to update the firmware with the actual calibration data of your voltage reference. There are Constants (cal_XXv_ref) in the firmware to add them. These values will be used to get a higher accuracy. You also need to start with the reference voltage (v-ref) set at the typical 4.09600V.
Note: There is provision in the setup function in the firmware to force the storage entry of initial values in the EEPROM.
1. The Null Calibration
With the Null Calibration, the zero Volt level of the meter is adjusted. This will eliminate any voltage difference between the positive ADC input and ground. To prepare the meter for the Null Calibration, short the two input terminals together with a short cable. Before you run this calibration, allow the meter to warm-up for about 15-30 minutes. You can then invoke the Null Calibration by a short press of the cal button.
The display will show "Zero Calibrate" on the first line and "Short the input" on the second. After 3 seconds the adjustment starts. The meter will take 75 samples (Constant cal_adj_samples) and that number is shown on the display. The samples are averaged and the result is stored into the EEPROM. The result is shown on the display after which the meter starts with the normal operation again. This obtained Zero Cal value will be subtracted from all measured values from now on.
2. The Voltage Accuracy Calibration
The Voltage Accuracy Calibration is used to calibrate the meter against a Voltage Standard. This calibration assumes you have already performed the Null Calibration. There are several parts to perform the Voltage Accuracy Calibration.
The ADR4540B Reference Calibration
This is an optional step that can be performed to get the maximum accuracy. The ADR4540B reference outputs a typical voltage of 4.096V. However, this has some tolerance as you can see in the datasheet. To accommodate for the tolerances, we can record the true output value and use that in our voltage calculations to get a higher precision.
This step only needs to be done once after you have built the meter, and afterwards maybe every year to accommodate for aging. You first need to measure the output voltage of the ADR4540B reference and add that value to a Constant (v_ref) in the firmware. If you have a high precision and accurate 6+ digit DMM, you can use that to measure the output of the reference and store the result as a Constant (v_ref) in the firmware. I soldered a test point to the PCB to allow me to connect test leads to measure this typical 4.096V reference voltage.
If you do not have access to such a precision meter, you can use the Micro-Volt meter itself to do that as well. This is a bit more cumbersome, but can be done. To measure the true value of the reference, you first need to calibrate the meter against a 5V reference. The 5V reference is very close to the typical 4.096 reference Voltage, so the precision is optimal. The firmware has provisions for all major Voltage levels the most common references have. I have included separate routines in the firmware to calibrate the meter against 4 reference Voltages, 2.5, 5.0, 7.5 and 10.0V.
To measure the ADR4550B, you need to activate the 5V reference function in the firmware by activating the Ref_Cal_Adjust5() function in the Button_press function. You also need to add the calibration values of the Voltage Calibrator as Constants (cal_XXv_ref) in the firmware.
You also need to set the Voltage level of the reference into the Constant (v_ref). Start with a value of 4.09600V.
Before you start this special calibration, close the lid and connect the meter to the Voltage Reference that is set to the 5V output. Let the meter and the Voltage reference warm-up for about 30min to an hour. Start the Accuracy Calibration by performing a long press of the cal. button. The first line of the display will list the Calibration Voltage "5.0V-Ref Cal" and on the second line "Connect V-Ref. After 3 seconds, the meter will start to measure the Voltage 75 times (Constant cal_adj_samples) and shows this number on the display. The averaged result is then calculated by using the value of the reference that still has 4.09600Volt and the difference between the measured result and the value entered in cal_XXv_ref is stored in the EEPROM. This value is now used in the voltage calculation as you can see in the firmware.
With the meter now calibrated towards the 5V reference, you can now measure the voltage of the ADR4540B reference. I'm assuming that the meter has still been properly warmed-up. To perform this measurement, open the lid, connect the leads of the meter to the ADR4540B reference, and close the lid as much as possible. Let the meter reading stabilize for several minutes and record the measured value. This value can now be entered as the new v_ref in the firmware. I have two values in the firmware because I have two meters, meterA and meterB.
3. Voltage Accuracy Calibration
After you have entered the true reference value result in the firmware, run the 5V Calibration again. The resulting value will now be calculated with the actual v-ref value, and stored in the EEPROM. If you want to be very precise, you can measure the ADR4550B again, update the v-ref number, and run yet another 5V Calibration to get the optimum calibration. The meter is now ready to be used.
Note!
It should be clear by now that you should not re-calibrate the meter all the time. If you entered the Accuracy Calibration step by accident, by pressing the button for too long, turn off the meter before the result gets entered into the EEPROM, otherwise you have to perform the whole procedure with the Voltage Reference again. There is no need to redo the ADR4540B reference again, so you can skip this step.
4. Final CalibrationAfter I calibrated my two meters, I tried to calibrate them with all 4 available calibration voltages, 2.5V, 5.0V, 7.5V and 10.0V. I found that I had the best linearity result by using the 10V0
reference calibration.
After I performed the 10V calibration, the overall linearity turned out to be the best:
Reference Voltage Measured Voltage Delta %
2.49993 V 2.49953 V -400uV -0.016%
5.00181 V 5.001515 V -295uV +0.059%
7.50547 V 7.50534 V -130uV +0.0017%
10.00673 V 10.00672 V -10uV +0.00001%
That is good enough for me. If I have a need to really measure very
precise in the sub-volt range, I can still do the 2.5V calibration to
improve the linearity at these lower voltages.
Using a trick to measure with an offset
The LTC chip can actually measure an input range of +/- 12.5% of the reference voltage, so what you can do with this feature is to null the meter not with a short, but with the voltage you want to monitor, say a 2.5V reference at the input. In that case, the reading of the meter starts at 2.5V and shows the difference on the display based on the 2.5V. With this trick, you can then measure voltages like the drift with micro Volt resolution over time. (this includes the drift of the meter itself as well of course, but still)
Latest firmware
The firmware can be found and downloaded from my Github site:
https://github.com/paulvee/6-digit-milli-voltmeter :
I am sure you will enjoy this tool as much as I do!
Have fun!
[Update: June 2020]
Adding a logging Facility
For another project I'm working on, I needed a method to log the measured values of the meter, and later display them in a graph. I have added a new version of the firmware (V3.13) on the Github site that already has some changes to the firmware to start to do that. With the new version, the measured values are output in micro volts every second at the serial out pins of the Arduino, and can be seen and logged when you use the Arduino IDE and the Serial monitor. To add timestamps to the measurements, you can invoke the "Show timestamp" feature of the Arduino IDE Serial Monitor. A simple copy and paste of this data to an Excel file allows you to analyze the data and create a graph from it.
Here is a graph of measuring the voltage of an AA 1.5V battery cell. With 6 decimal digits, the meter displays down to 1 micro-Volt. At this level of sensitivity, the slightest changes in temperature or even air movement will have a noticeable effect. Keep the lid on the meter and don't wave your arms in excitement!
This graph is the output of my Siglent SPD3303 power supply set at 5.000V. This shows a drift of about 150 micro Volt over a period of 1 hour.
This is a graph of one of my references, on the 5V setting. Note the micro Volt sensitivity again. The number of decimal digits can bet set in the firmware, or dropped from the collected values by an Excel formula.
I made the same measurement (not at the same time) using my 80.000 count 4-1/2 digit DMM, a Vichi VC8145 using the logging software from Dick Grier.
link to software
He and I worked together to make it a little better. Note that the calibration of the meter after 4 years is a little off.
To me, this clearly shows the additional value the extra digits of the milli-Volt meter adds, and why I wanted to build the milli-Volt meter in the first place.
So how much noise and drift is coming from the meter itself? I nulled the meter, and while the shorting lead between the input terminals stayed connected, I measured the resulting input drift and noise. Over a period of about 30 minutes, I measured between +4 and -2 micro-Volt of noise, but no drift.
These graphs show how good this DIY meter is. This is a testament to the parts used, the design and the board layout of this meter. You will be hard pressed to get this level of sensitivity and accuracy in commercial products, unless you are prepared to pay hundreds of Euro's.
WARNING
This logging software addition is the bare minimum because to make it really usable and safe, I need to add an optical separation of the meter and the PC or whatever device you use that collects the data. The reason is that by connecting a serial to USB cable from the meter (the Arduino) to the other device you could possibly connect the DUT to earth ground, and that defeats the battery operated meter function. It also no longer allows you to make floating measurements when the meter is on battery power. Having no optical separation could be unsafe too! Know what you're doing and be aware...
Optical Isolation
I have finished the hardware for the optical isolation section. The simple circuit is as follows:
I have tried this circuit with 9600 baud and it works very well with these components. If you decide to use other optical isolators, you may have to tweak the emitter resistor values. Keep them as low as possible to keep the rise times in check.
If that still poses a speed problem, there is a nice circuit addition that the late Bob Pease (Lineair Technology) designed (look in his book Troubleshooting analog circuits) that uses one additional transistor to speed-up the rise times. I tried that, just for fun, and even without the positive feedback resistor R8 which would improve the fall-time even further. The circuit works very well, but is an overkill for this application at 9600 baud.
Below is the isolation circuit I added to the DMM.
The connections on the left side go straight to the pins on the Arduino Pro Mini. The connections on the right side go to a serial to USB convertor board. There are several versions of these boards around, and they only cost a few Euro's. You need them to program the Arduino Pro Mini anyway. The particular one I used has a feature to let it work with 3V3 and 5V systems, selected by a jumper.
I have de-soldered the USB connector from the serial to USB board, and added header pins to the 4 connections. From these 4 header pins, I go to a USB cable that ends in an isolated USB micro chassis part that is mounted on the back panel.
The cable can be ordered here :
panelmount There are versions with stripped wires and with connectors, which is what I ordered. The cable shield is available to connect it to ground.
Caveat
I implemented a fully bi-directional optical interface with the intend to also program the Arduino with this setup. Unfortunately, I can't get it to work. This means that you could eliminate the receiver circuit around VO1 and only let the Arduino send data.
I don't have the DTR connection on my setups, so there is no automatic restart of the Arduino when the downloads starts. I always have to press the reset button as soon as the script starts to download. That cannot be the problem though.
I have tried to figure out why it does not work, also looked all over
the web, but I was unsuccessful. If any of you know what to do to make
it work, please chime in.
Final test run
To test the logging feature, I used one of my voltage references again. The reference was set at 2.5V because that is also the intended voltage level on a device I need to test, a GPSDO. The calibration of the 2.5V was written on the reference to be 2.49993V at the time, now a few years ago. I did not let the units warm-up, after switching them on I started logging right away. Here are the results:
The logging of the voltage was every second and started at 8:43 in the morning. At 2.125 seconds (around 9:18), there was a rather "large" glitch of a few 100 micro-Volts that lasted about 200 seconds. On the right is a more detailed graph. Unfortunately, I have no idea what caused it. Was it the reference, or was it the DMM? I was not running on batteries, so it could have been the mains voltage. Who knows...
In any case, you can see the voltage very slowly moving up until about 20.000 seconds, when there was a wriggle of a few micro-Volts, and after that it stabilized. I started with a voltage of 2.499515 and stopped 8 hours later with a voltage of 2.499635. The room temperature increased because the sun was out. This may have been the cause of the slow increase. I did not keep track of the temperature when I recorded this. With these sensitivities, you really need to.
Conclusion
The setup of the voltmeter and the reference shows no significant drift, the measured voltage moved up by a mere 120 micro-Volt over a period of 8 hours and is therefore very stable over a very long period of time. This test proved and showed exactly what I needed to know before I started to apply it to my intended application. I just hope the glitch never happens again, ruining a long measurement.
Enjoy!
BTW, I sold one of my two units, and I still have one bare PCB available for sale (5 Euros + S&H). Contact me if you're interested.
If you like what you see, please support me by buying me a coffee:
https://www.buymeacoffee.com/M9ouLVXBdw 


.png)